
 Michal Molenda
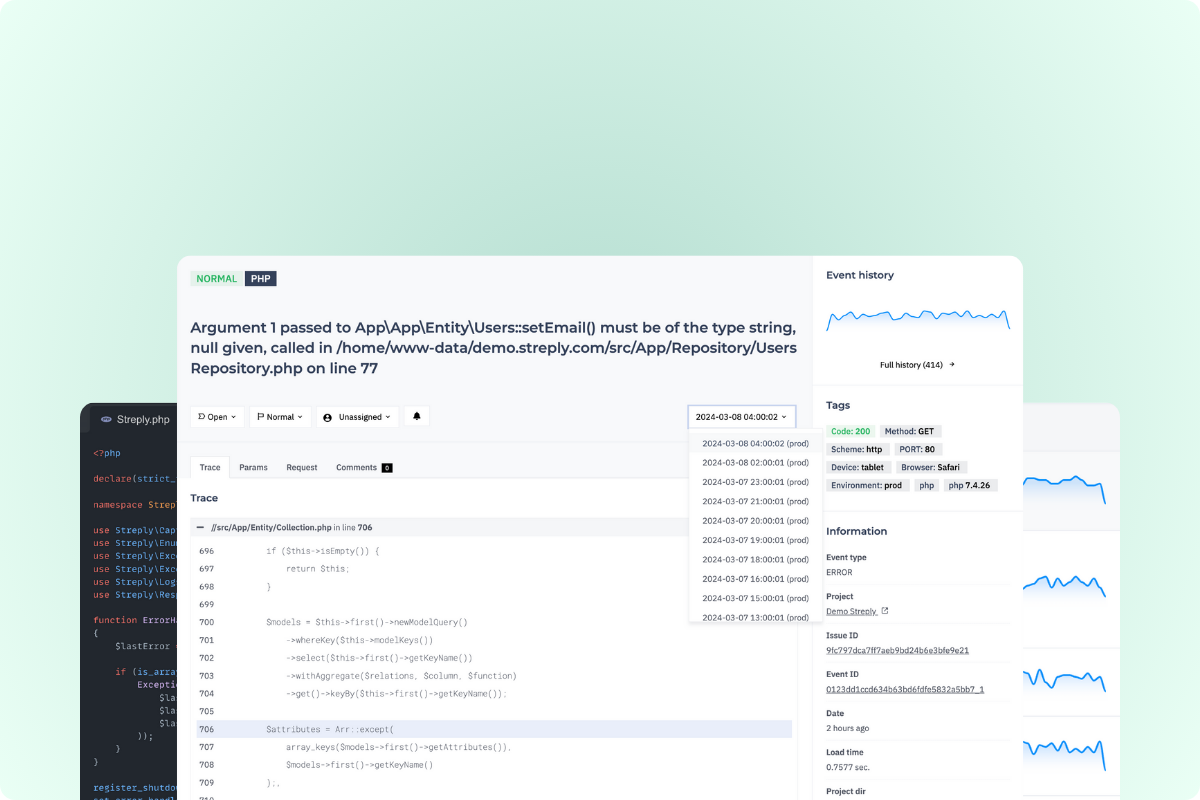
The all-in-one monitoring app for smart devs.
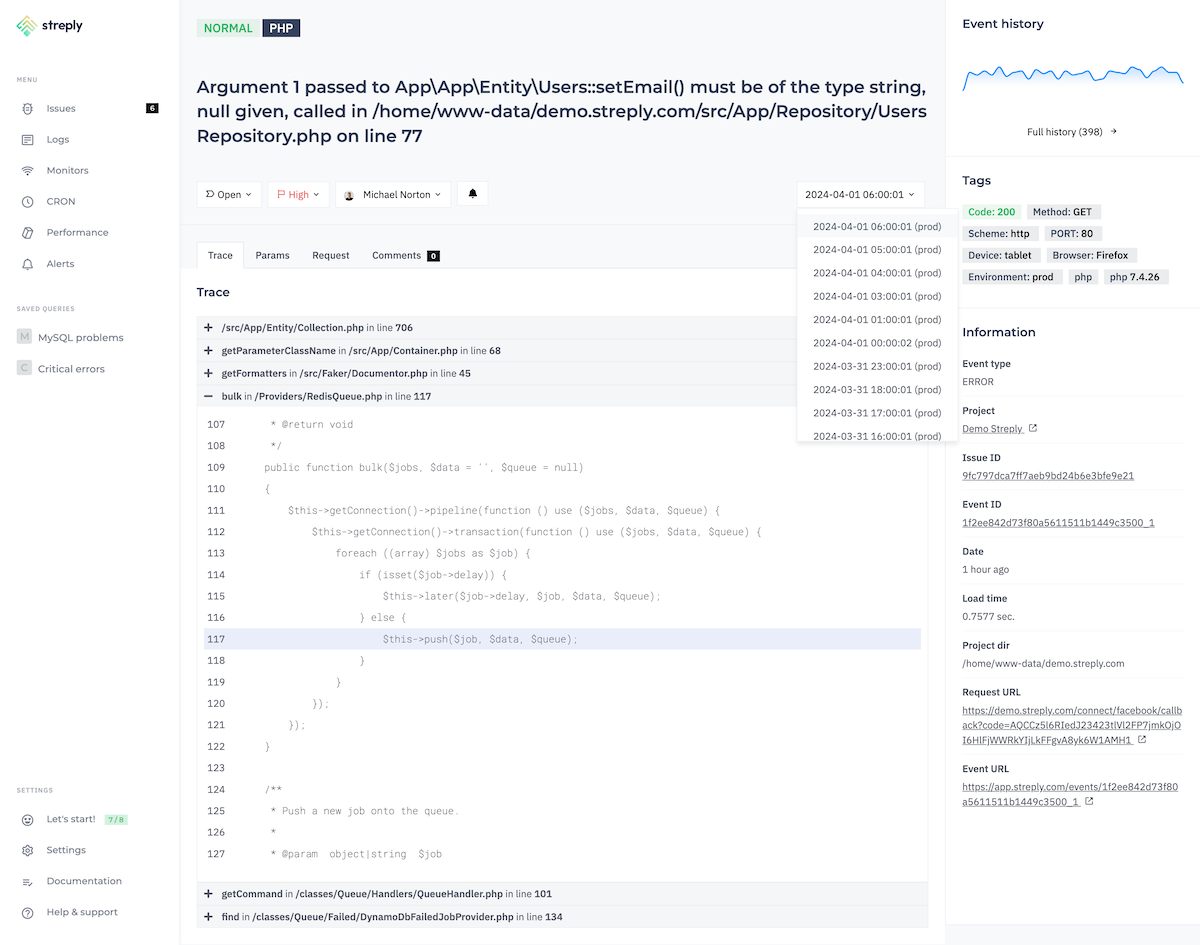
Manage all errors and exceptions from your projects in a single cloud-based application.
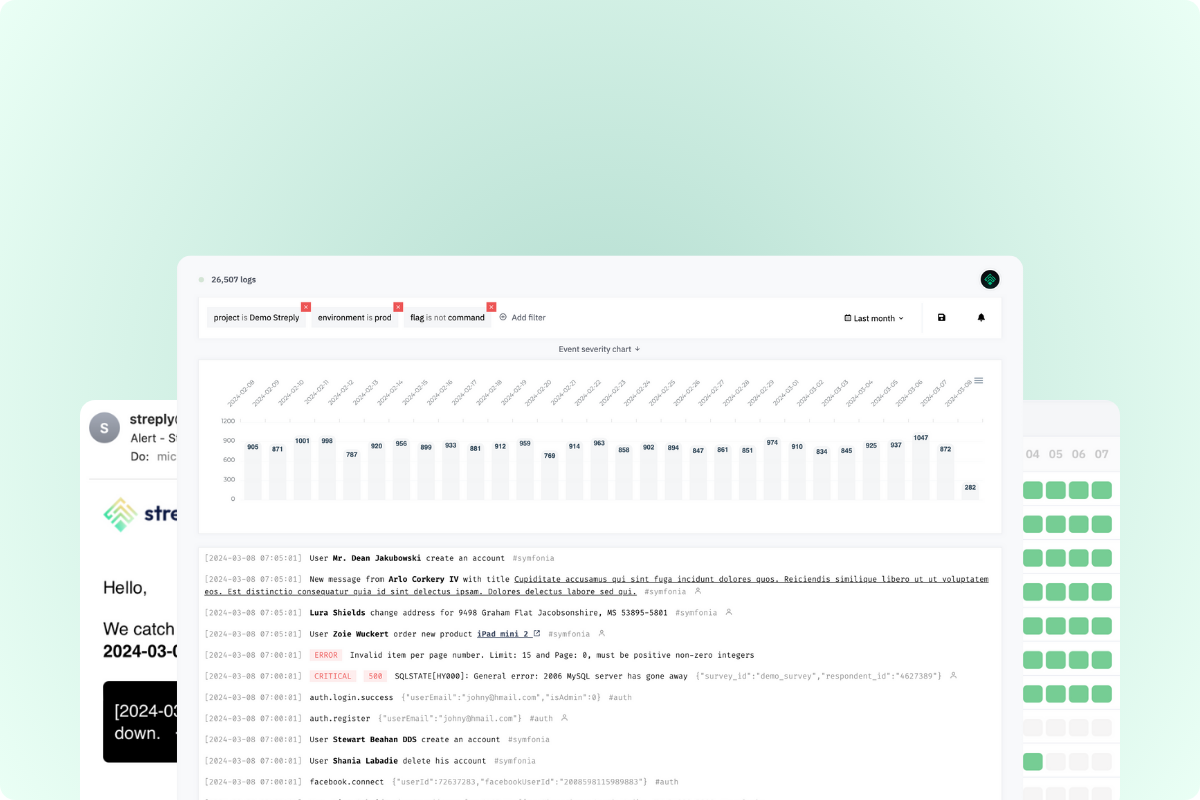
Consolidate all your logs into organized data and easily analyze everything using a user-friendly query builder.
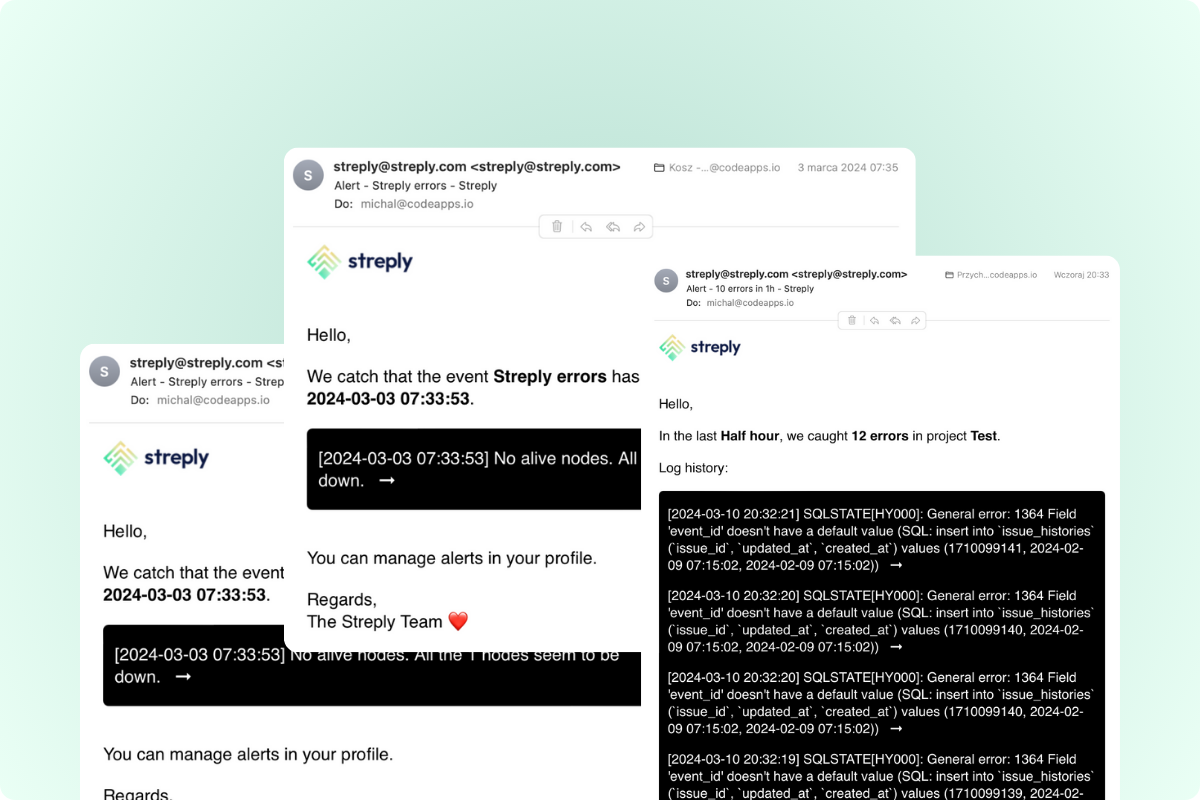
Find out if your app stops working before your users do. It's really important!
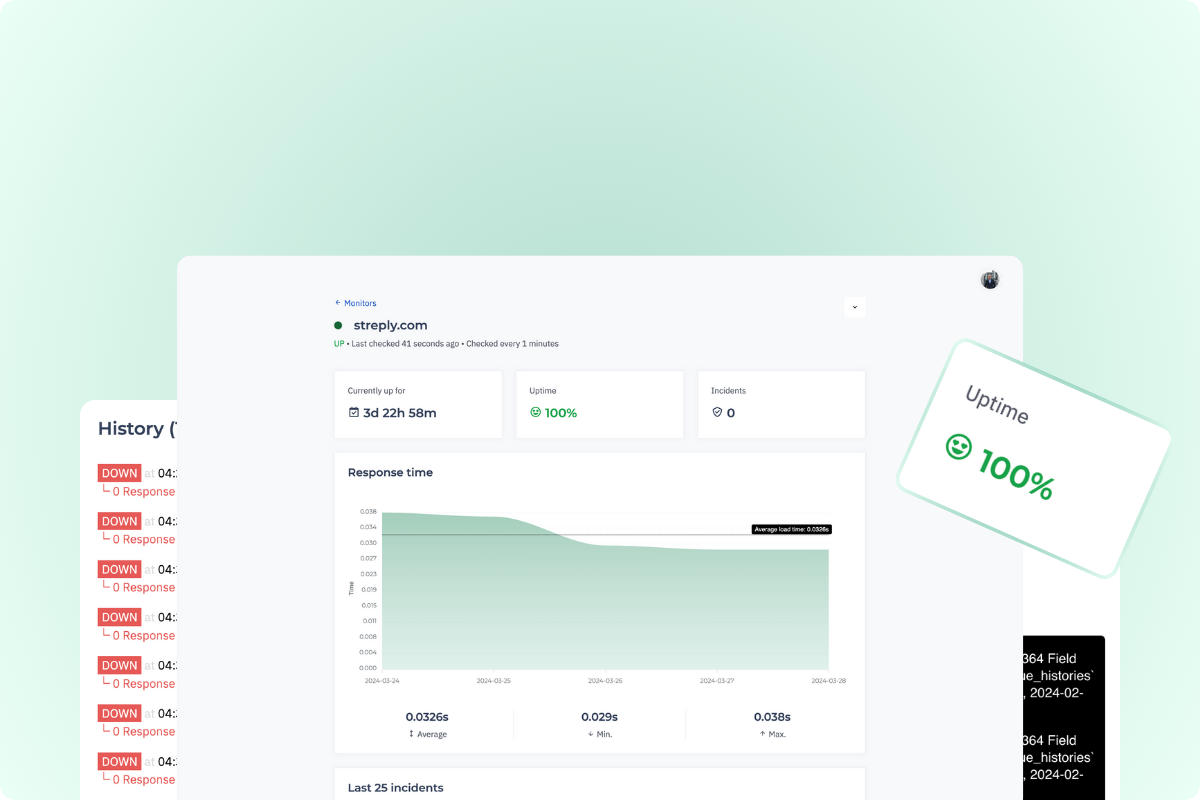
Streply will notify you promptly if there are any issues with your apps or if your app goes down.
Cron Monitoring lets you keep track of how and when background jobs work and how well your scheduled tasks are performing in your projects.
Application speed is key, measure how fast your code runs and where the bottlenecks are. Not just the whole application, but also individual fragments.
Getting started is simple
We've got libraries available for all the popular programming languages and frameworks out there. Installing will take just 5 minutes.
Install using composer:
composer require streply/streply-php
Initialize Streply on beginning your code:
Streply\Initialize('https://clientPublicKey@api.streply.com/projectId');
Install the streply/streply-laravel package:
composer require streply/streply-laravel
Add the service provider to config/app.php and enable capturing exception in App/Exceptions/Handler.php:
public function register()
{
$this->reportable(function (Throwable $e) {
try {
\Streply\Exception($e);
} catch(\
Configure the Streply DSN with this command:
php artisan streply-laravel:publish https://clientPublicKey@api.streply.com/projectId
Install the streply/streply-symfony package:
composer require streply/streply-symfony
Add the bundle to the list of registered bundles in config/bundles.php:
return [
    ...
    Streply\StreplyBundle\StreplyBundle::class => ['all' => true]
];
Add default configuration in config/packages/streply.yaml and add DSN info to .env file:
streply:
  dsn: '%env(STREPLY_DSN)%'
The first step is loading the script with SDK:
<script src="https://app.streply.com/js/%token%.min.js"></script>
Catch exceptions:
try {
    nonExistsFunc("Welcome!");
} catch(err) {
    Streply.Exception(err);
}
Install the streply/vue package:
npm install --save @streply/vue
Then initialize Streply:
import { createApp } from 'vue'
import App from './App.vue'
import * as Streply from '@streply/vue';

const app = createApp(App);

Streply.init(app, {
    dsn: 'https://clientPublicKey@api.streply.com/projectId',
});

app.mount('#app')
Install the streply/vue package:
npm install --save @streply/react
Then initialize Streply:
import React from 'react';
import ReactDOM from 'react-dom';
import * as Streply from '@streply/react';
Streply.init({
dsn: 'https://clientPublicKey@api.streply.com/projectId',
});
ReactDOM.render(
Install the streply package:
pip install --upgrade streply-sdk
Then initialize Streply:
from streply.streply import streply

streply('https://clientPublicKey@api.streply.com/projectId')
Trusted by many dev teams
"I can recommend Streply to any programmer who needs a tool to improve work with errors, quick access to logs, and notification when a problem occurs."

"Working on many projects, I use Streply to have all bugs and logs in one place. And thanks to notifications, I won't miss any errors. It's really improved my work."

Pricing plans for teams of all sizes
Our pricing is very simple. You only pay for what you use. That's it!
From devs for devs.
FREE
ChooseFor rapidly growing startups.
$30 /month
$25 /month
Start free trialMost popular
For small teams.
$100 /month
$85 /month
Start free trialFor future unicorns.
$200 /month
$170 /month
Start free trialNeed more requests? No problem, please feel free to contact us at support@streply.com.
Read articles for all developers.
Michal Molenda
 Michal Molenda
 Michal Molenda