We're Streply, a tool that tracks errors and manages logs quickly. It's easy to set up and compatible with many popular frameworks. Made by developers, for developers! If you need to keep an eye on errors and follow logs in your app, create free account.
We are constantly working on the development of Streply to make working with our tool as beneficial as possible, but also as convenient as it can be. We have just launched a new version of the performance module, which enables us to analyse the speed of both the entire application and individual code fragments and suggests where the bottlenecks are.
The data in the performance module is divided into two key types:
- Project view - data collected automatically by Streply that analyses the performance of the entire application.
- Transaction view - a transaction is a selected piece of code that you want to analyse. In addition to measuring the entire transaction, Streply allows you to create points within a transaction to also measure smaller parts of code inside the transaction.
With the new version of the module, these elements can be analysed in detail so that the development department knows which elements need to be optimised and why.
Feel invited!
Projects list
The first view that will show up for users who have more than one project is the project selection screen. Widgets with a history of the average loading time over the last few days allow you to see at a glance the performance of your projects.
The graphs are generated in real time, so you will immediately see when the average loading time of any of your projects increases.
Project dashboard

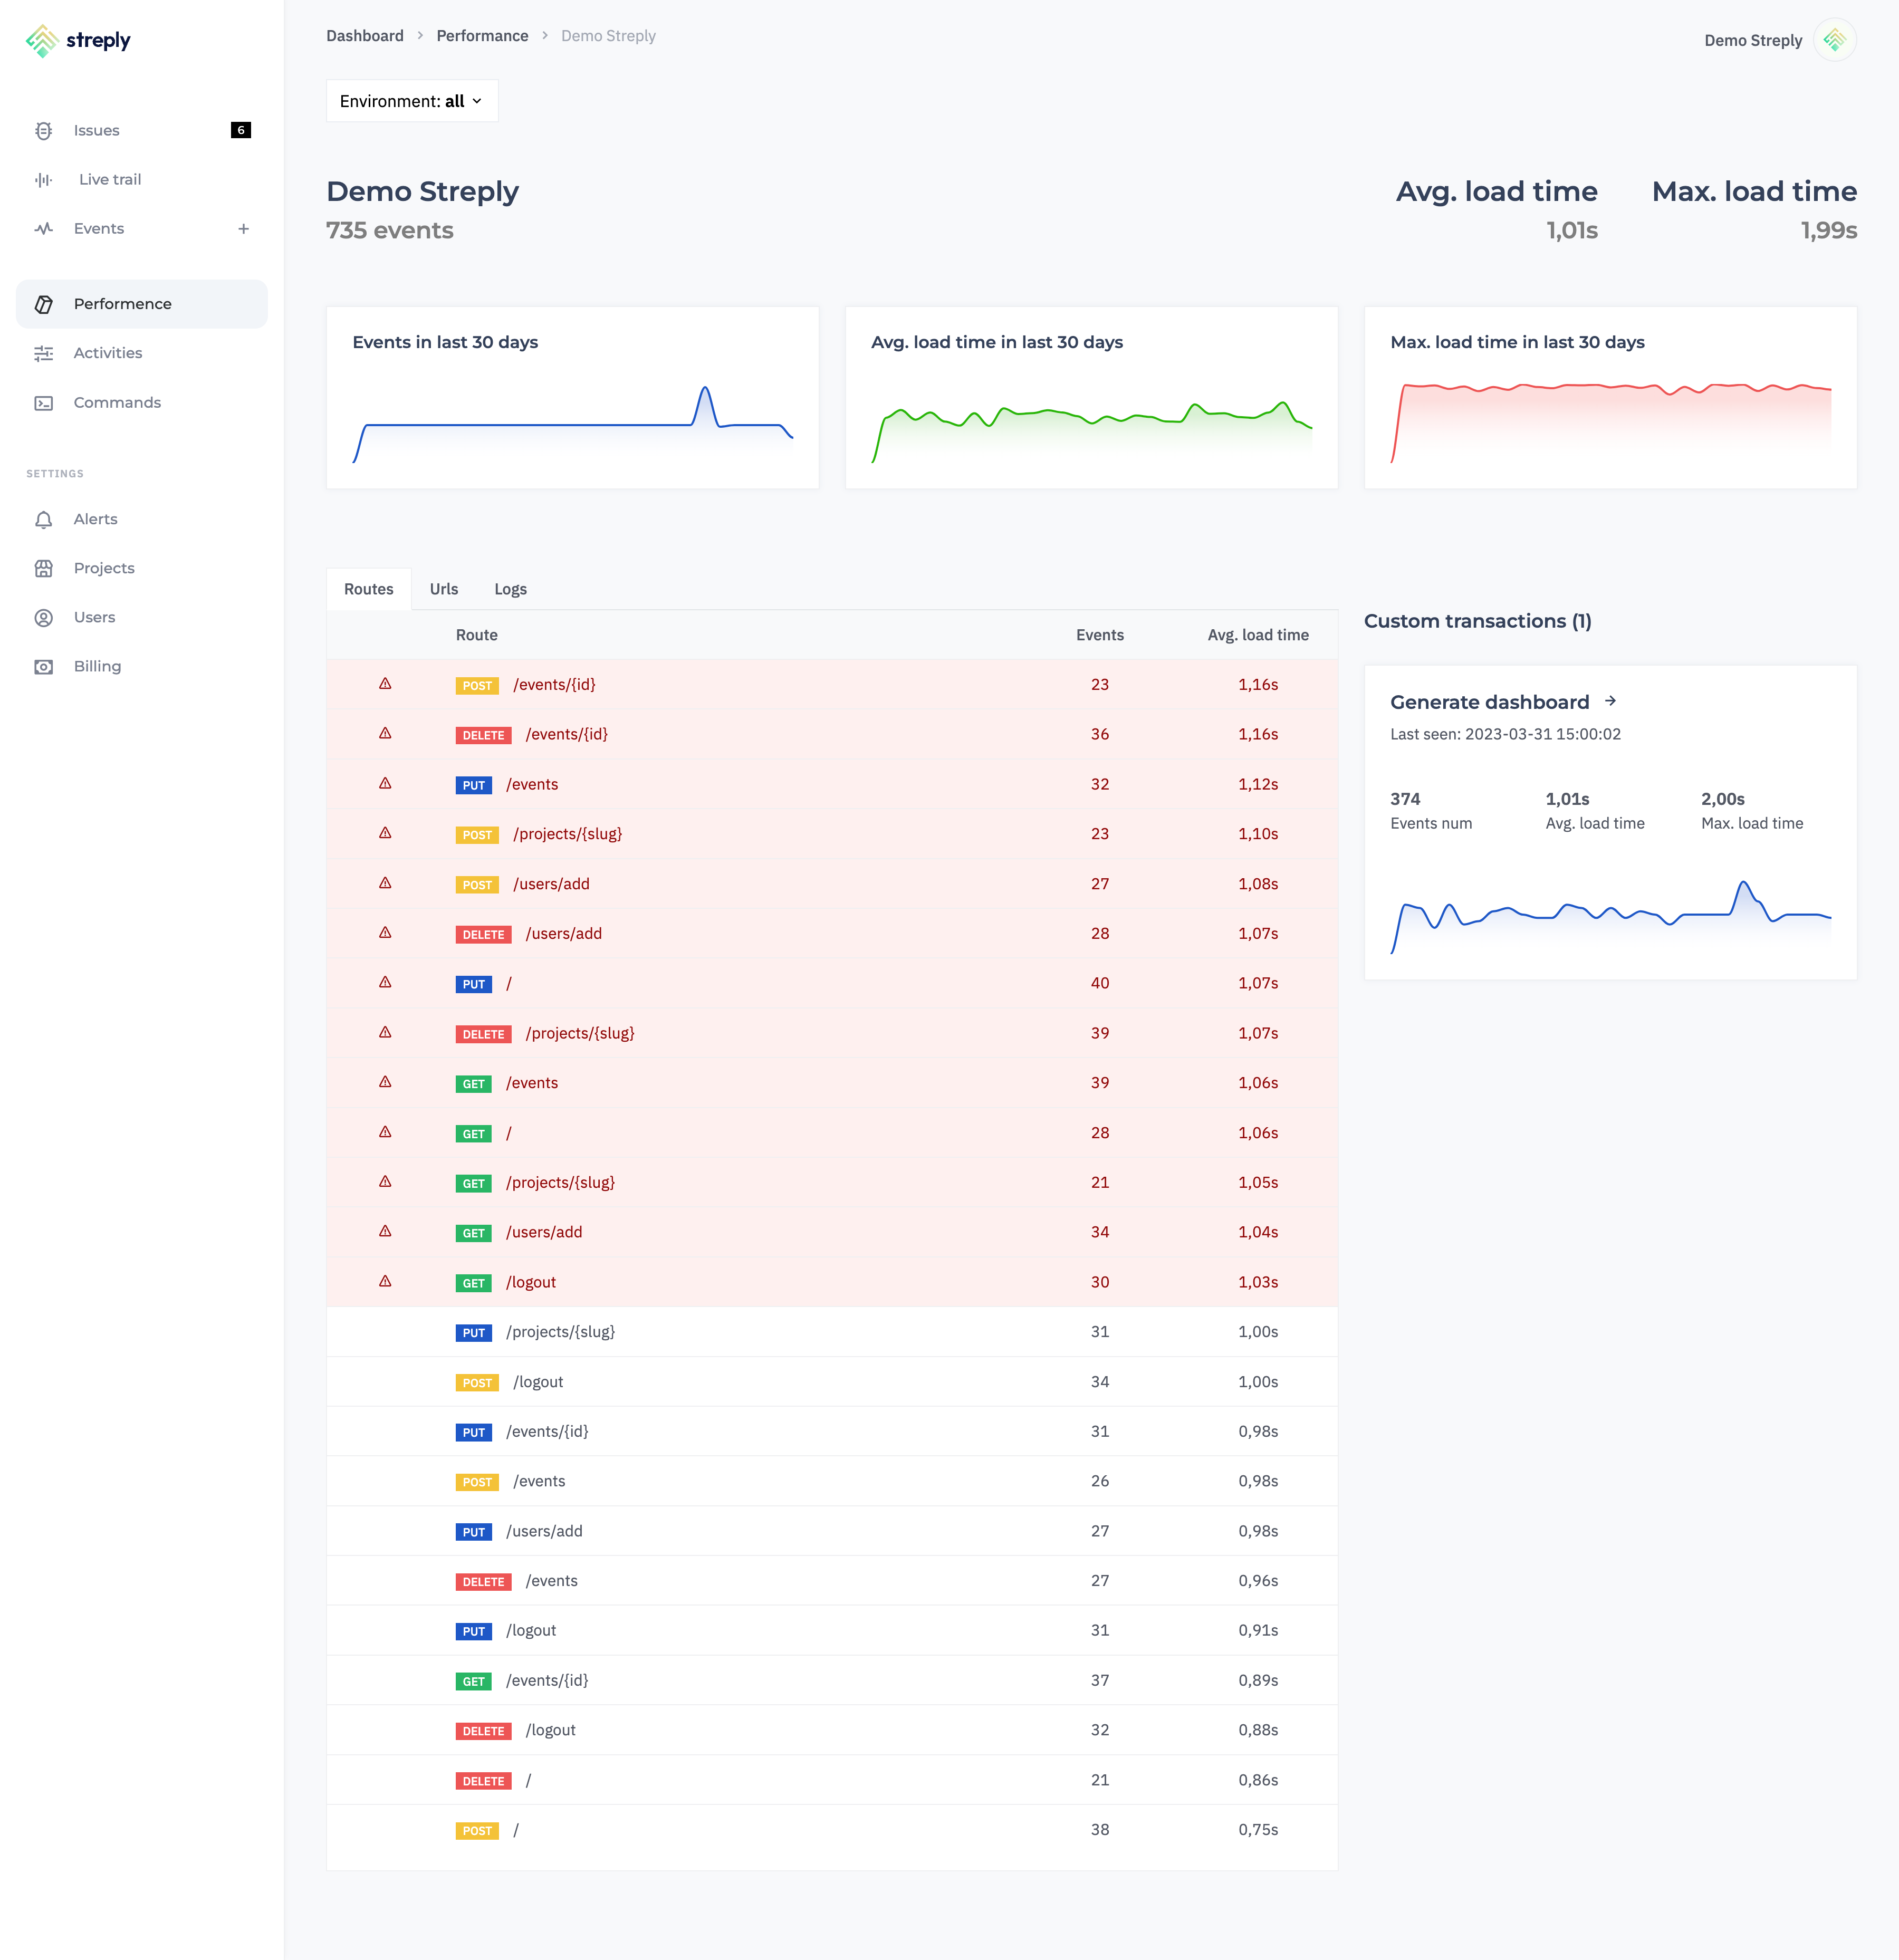
Each project has its own dashboard, which contains the most important information. At the very beginning, we see the number of events collected, the average and maximum loading time. Below, we have graphs of the 30-day history for each of these data.
We can then analyse endpoints1 and URLs whose average loading time is higher than the average for the entire application. This allows us to find elements that still need to be worked on for optimisation.
The third tab is the logs, i.e. all performance events. With these, we can view the loading times of individual inputs and information about them. This tab allows us to check a specific user and request.
In the sidebar, widgets are available for each custom transaction. We can enter the transaction view or take a quick look at the number of events, average and maximum loading times and a 30-day history of average loading times.
1 For Streply to correctly generate data for endpoints, you need to use our libraries for frameworks. See how to do it in documentation.
Custom transaction

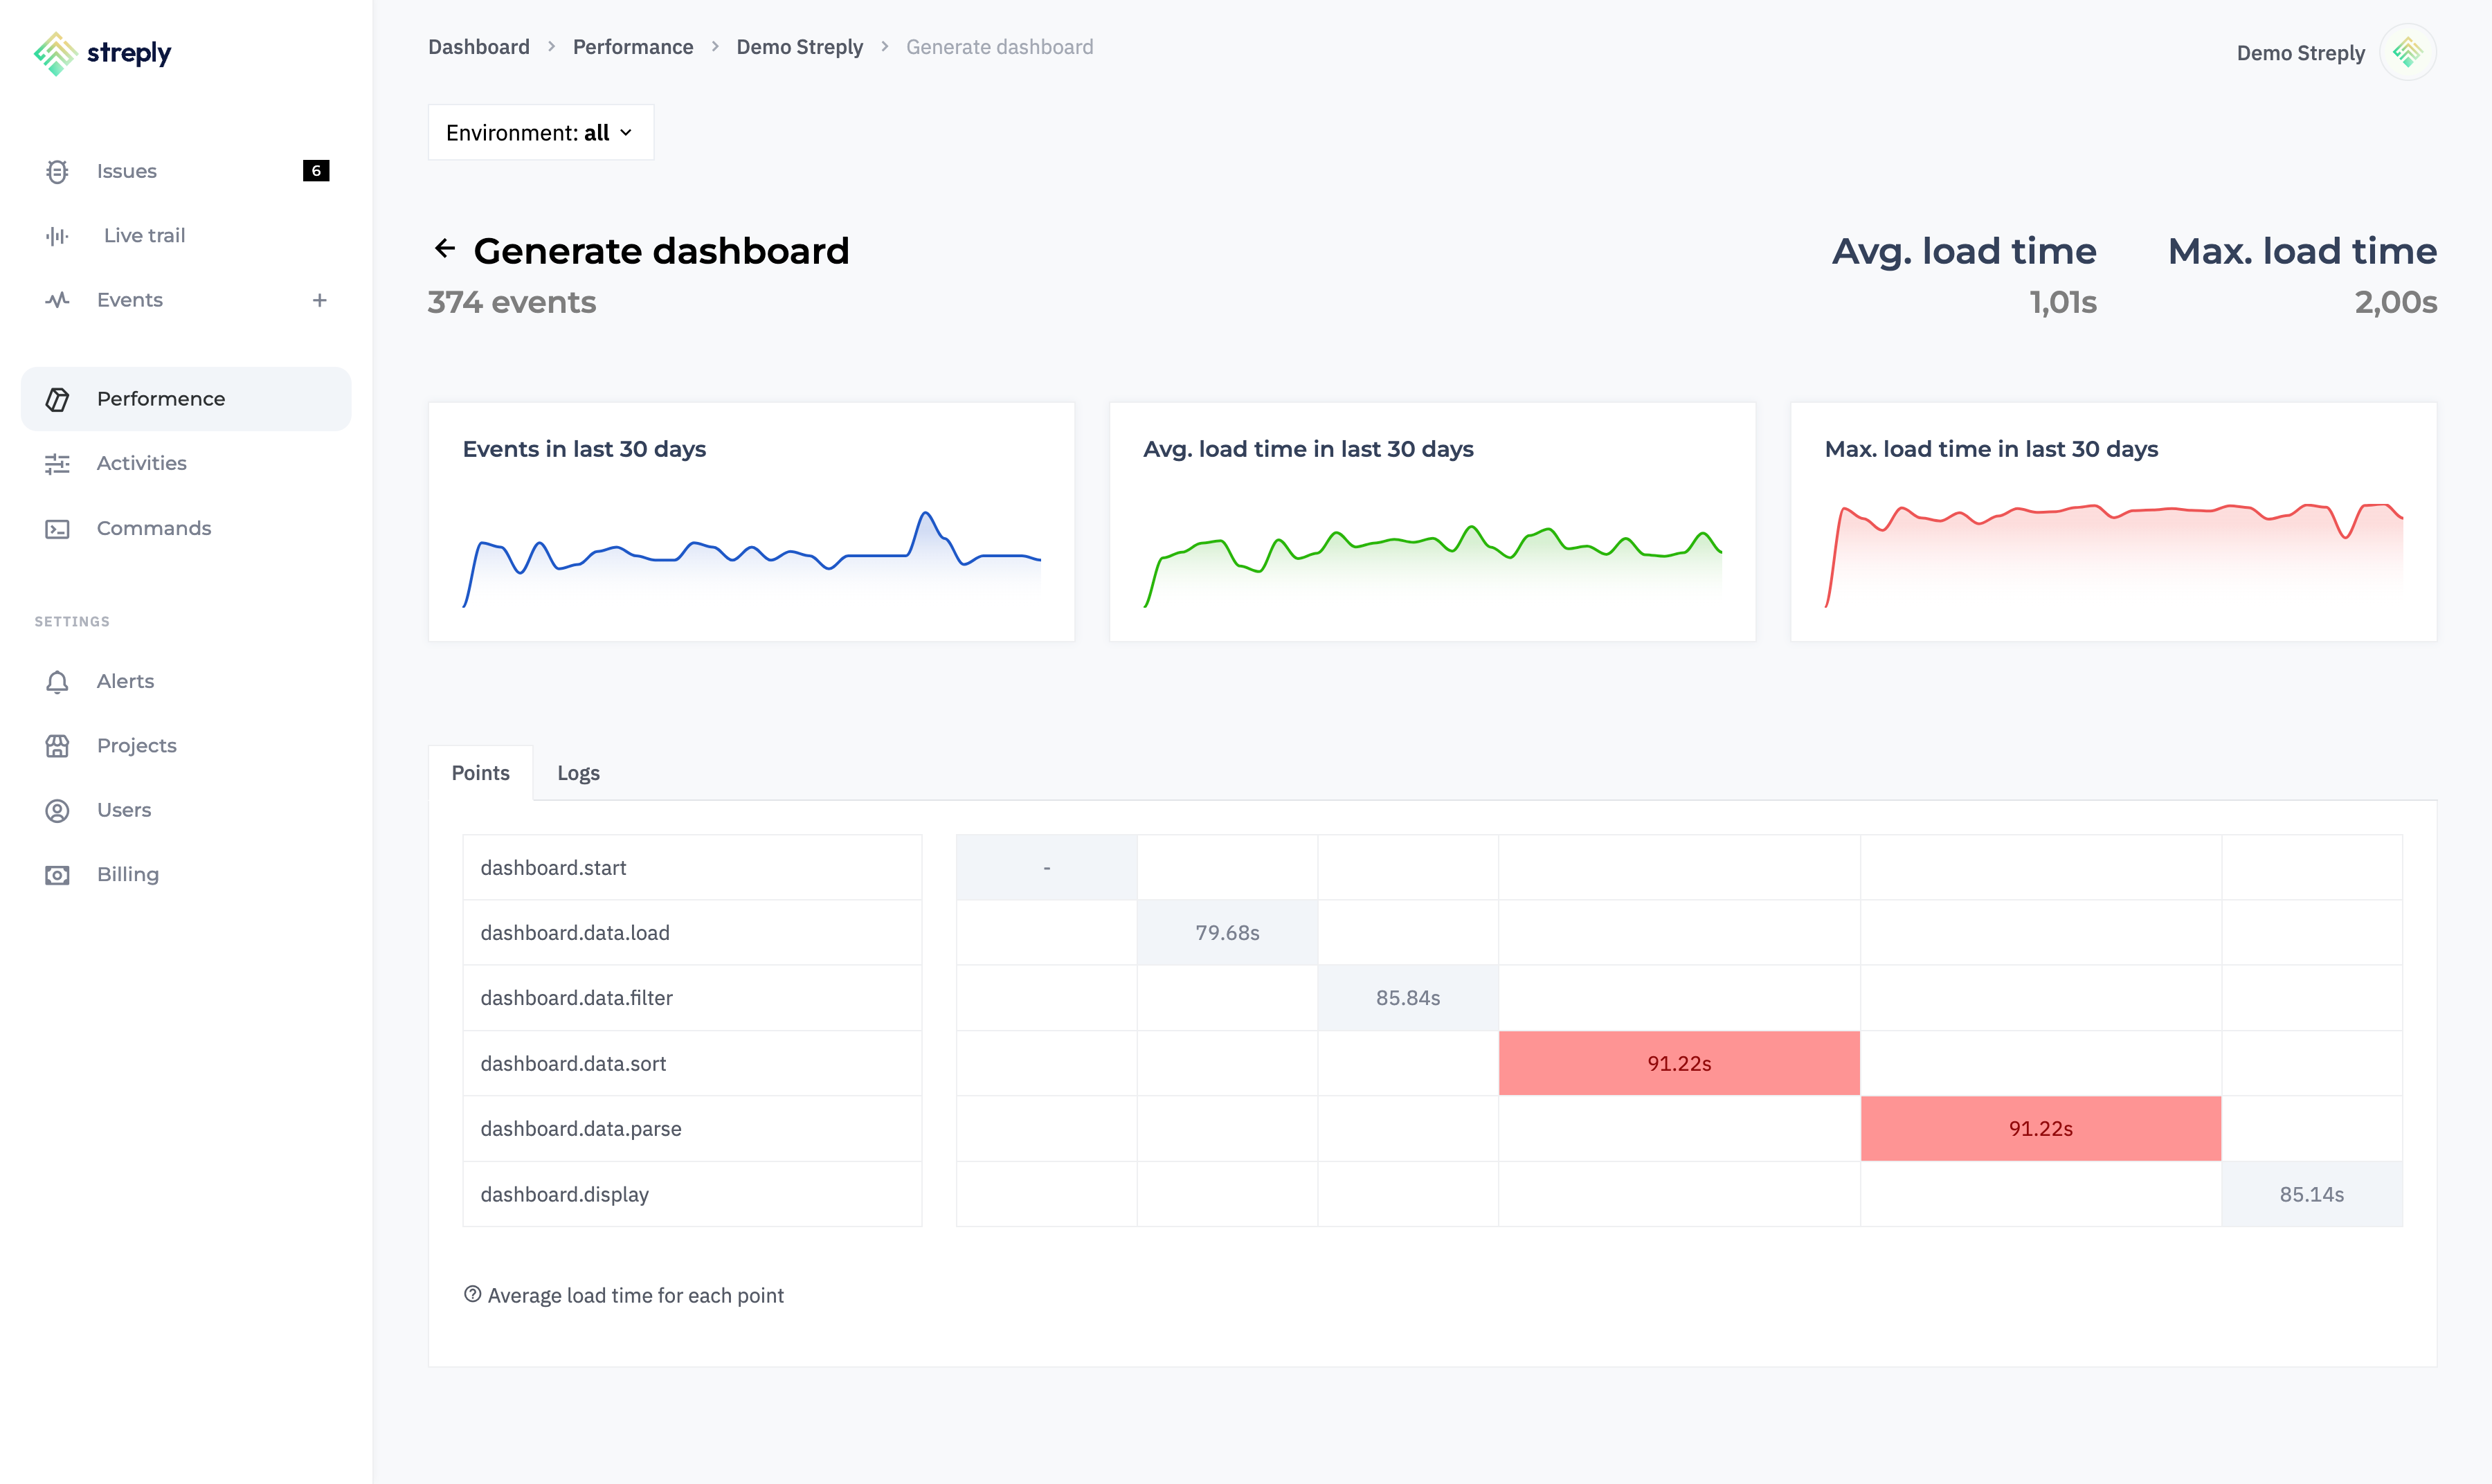
Each transaction, in addition to the standard information, allows you to add points. You can read how to do this in our documentation. After plugging in the points in a transaction, Streply will generate a timeline indicating which elements of the transaction are generating above average. This will allow you to analyse which elements are the bottleneck and need improvement.
In addition to the timeline, you can also view the logs, i.e. all the events that your application sent to Streply in this transaction. This allows you to check each request individually, analysing the exact data, both about the request and the user.
The new performance module not only allows you to analyse the entire project from different angles but also gives you access to detailed analysis of individual transactions that you yourself program into your project.
What do you think? Please let us know, we'd be grateful for any feedback or ideas!!! 🙂
- We are not pushy
- We only send a few emails every month. That's all.
- No spam
- We only send articles, and helpful tips for developers, not SPAM.
